The Math Behind Behavior Reduction
Presented by Matt Harrington
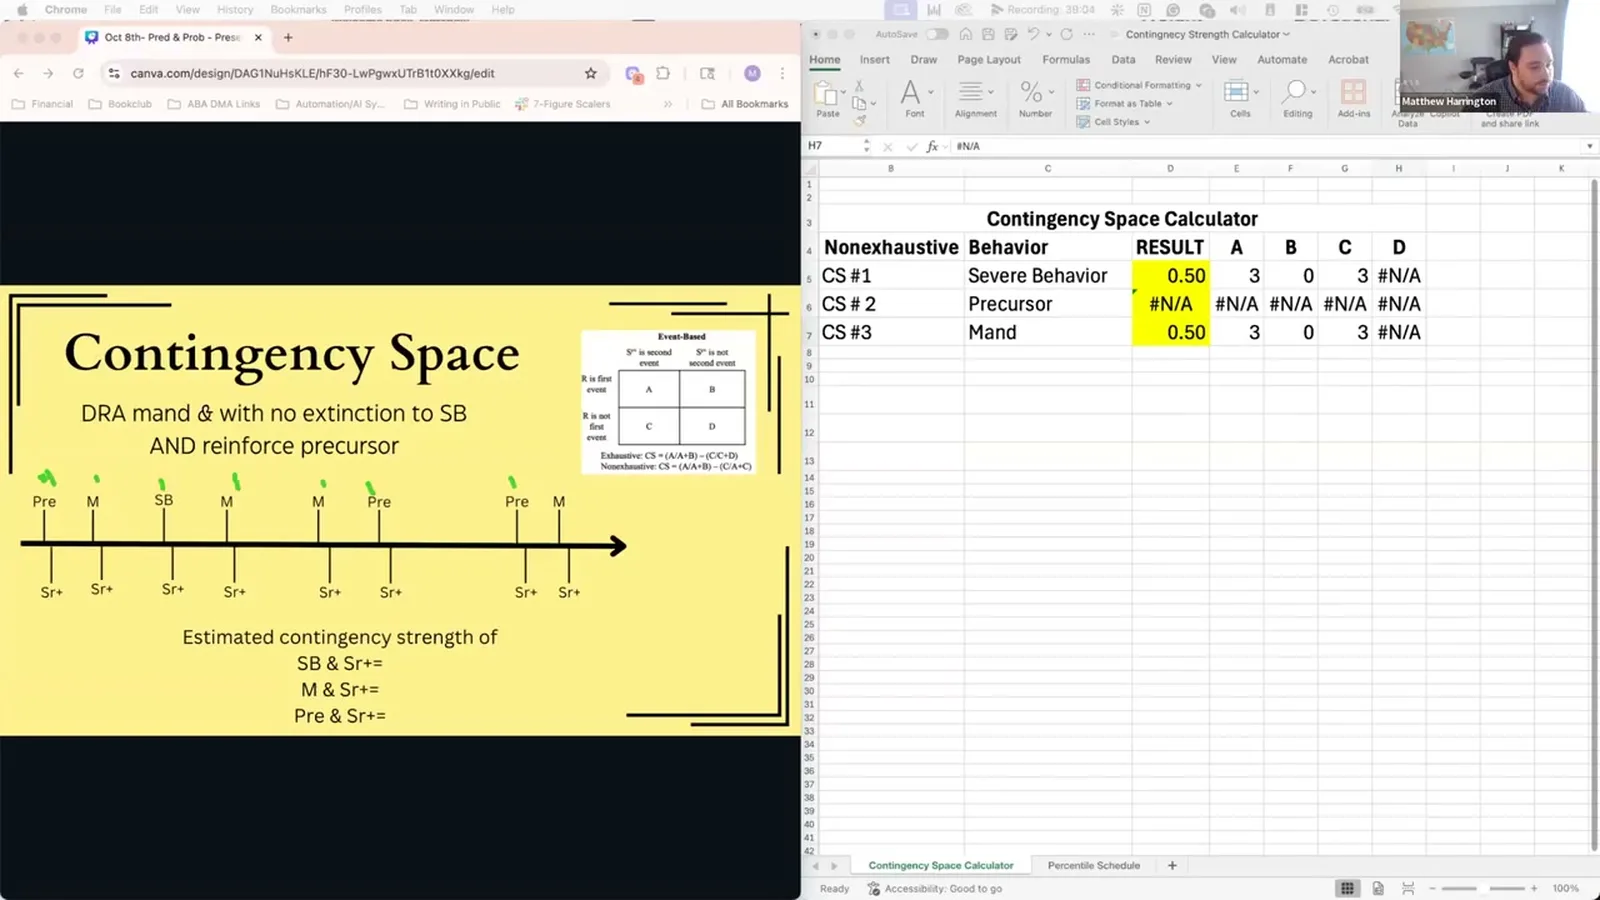
This webinar explores the mathematical foundations underlying behavior reduction interventions, moving beyond traditional "copy-paste" approaches to truly individualized treatment design. The presentation focuses on two primary mathematical frameworks: contingency strength analysis and percentile schedules for shaping. Participants learn how to use contingency space equations to objectively assess the probability that behaviors will result in reinforcement, enabling clinicians to predict intervention outcomes before implementation. The webinar demonstrates how interventions like Functional Communication Training (FCT) work through manipulating contingency strength differentials between target behaviors and replacement behaviors. Additionally, the presentation covers the percentile schedule equation for objectifying the shaping process, including how to adjust reinforcement density and observation windows to optimize skill acquisition while managing risk. Through practical examples and calculations, attendees gain tools to make data-driven decisions about intervention modifications in real-time, reducing reliance on clinical "instinct" and increasing precision in behavior-analytic practice. The content emphasizes understanding the "why" behind interventions to enable truly customized treatment approaches across diverse populations and settings.
Register free & watch nowCancel any time. Cert delivered to your inbox the moment you pass the quiz.
Learner ratings
from 14 learners
100% would recommend this CEU to other professionals in their field (5 responses)
“Great”
— Ian S.“Great! I would like the Part 2”
— Mary L.“greart presentation!!! Def going to add this to my toolkit!!!”
— Lily C.“Looking forward to part 2! Understanding how to explain our rationale and ensure it aligns with our science is such a key feature of ABA -I know our staff, students, and myself will benefit from this presentation. Thank you!”
— Juliana P.“Interesting topic!”
— Katelyn T.“ty”
— Lisa W.
About this CEU
This webinar explores the mathematical foundations underlying behavior reduction interventions, moving beyond traditional "copy-paste" approaches to truly individualized treatment design. The presentation focuses on two primary mathematical frameworks: contingency strength analysis and percentile schedules for shaping. Participants learn how to use contingency space equations to objectively assess the probability that behaviors will result in reinforcement, enabling clinicians to predict intervention outcomes before implementation. The webinar demonstrates how interventions like Functional Communication Training (FCT) work through manipulating contingency strength differentials between target behaviors and replacement behaviors. Additionally, the presentation covers the percentile schedule equation for objectifying the shaping process, including how to adjust reinforcement density and observation windows to optimize skill acquisition while managing risk. Through practical examples and calculations, attendees gain tools to make data-driven decisions about intervention modifications in real-time, reducing reliance on clinical "instinct" and increasing precision in behavior-analytic practice. The content emphasizes understanding the "why" behind interventions to enable truly customized treatment approaches across diverse populations and settings.
From the talk
What was covered
Two equations run under most behavior reduction plans: contingency strength and percentile schedules. Work the numbers and you can judge a plan before you run it.
- Score the contingency strength of a behavior before you run a plan, not after the plan fails.
- Count A, B, and C events by hand. Then divide A by A plus B, and subtract C over A plus C.
- If the mand and the severe behavior both pay off half the time, the plan will not move it.
- Paying off the precursor is the move that drags the severe behavior's score down toward 0.1.
- Set W high with small steps when a miss is dangerous. Set W low when speed matters more than safety.
- Use the numbers to pick a fix in the moment instead of pulling a stock fix off a list.
Why Copy-Paste Behavior Plans Stop Working
Most of us learn to plan by copy and paste. A new case looks like an old case, so we run the old plan again. Matt Harrington says that approach carried him through his first year of practice. His supervision was good, and the match between the old case and the new one was close enough.
Then the work changed. He moved from clinic to telehealth, and from early intervention to older adults and social skills. The one to one match broke down. What he learned in school and in research no longer lined up with the client in front of him. He heard the same story from other behavior analysts as their caseloads got harder.
He points to PFA and SBT (a common assessment and treatment package) as the clearest example. He is trained in it and has run it dozens of times. Used with no changes, it can feel like a flowchart: do this, then do that. Step one goes fine. Step two goes fine. Then step three breaks, and the stock fix on the list may not match the break. The math in this talk is how he picks a fix that does.
So the more our field progresses in interventions that are clinician friendly, which is the direction we should be going, the more we're going to need clinicians to be able to apply hyper individualized solutions and not just pull from their toolbox of fixes.
From the talk — Matt Harrington
Contingency Strength: How Stuck a Behavior Really Is
Contingency strength (how tightly behavior and payoff link) carries the whole first half of the talk. Think of it as how taught, or how stuck, a behavior is. A long history of payoff makes a behavior hard to shake. A thin history makes it easy to drop.
Press the same button on your own coffee maker for two years and coffee shows up every time. Then one morning it does not. You press again, and again, and you poke at the machine. That long streak of reinforcement (payoff that keeps a behavior going) is a strong contingency. Now walk up to a strange machine in a coffee shop. You press once, get nothing, and you shrug and ask for help. There is no history there, so there is no strength to push against.
The number runs from positive one down to negative one. It is the chance the payoff follows the behavior, minus the chance the payoff shows up without it. In an ISCA test condition (a test session that sets off the behavior), the value is one. The behavior happens, the work goes away, the toys come back, every single time. Plain extinction (holding back the payoff every time) sits at the far other end. It can also read as null, because the math would ask you to divide by zero.
So contingency strength is the probability that future behavior will result in stimuli being provided based on past events.
From the talk — Matt Harrington
The Contingency Space Equation, Step by Step
The talk names one paper: Lloyd and colleagues, 2021, A comparison of analysis methods to estimate contingency strength. The method used here is the event based, non exhaustive one. It is not the most exact option on the shelf. Interval based and exhaustive methods both land closer to the truth.
So why use the rough one? Because you can run it by hand in a session. The exact methods need software or a data system to do the work for you. The goal is not a precise score for every client who walks in. The goal is a fast read on whether a behavior pays off often or rarely.
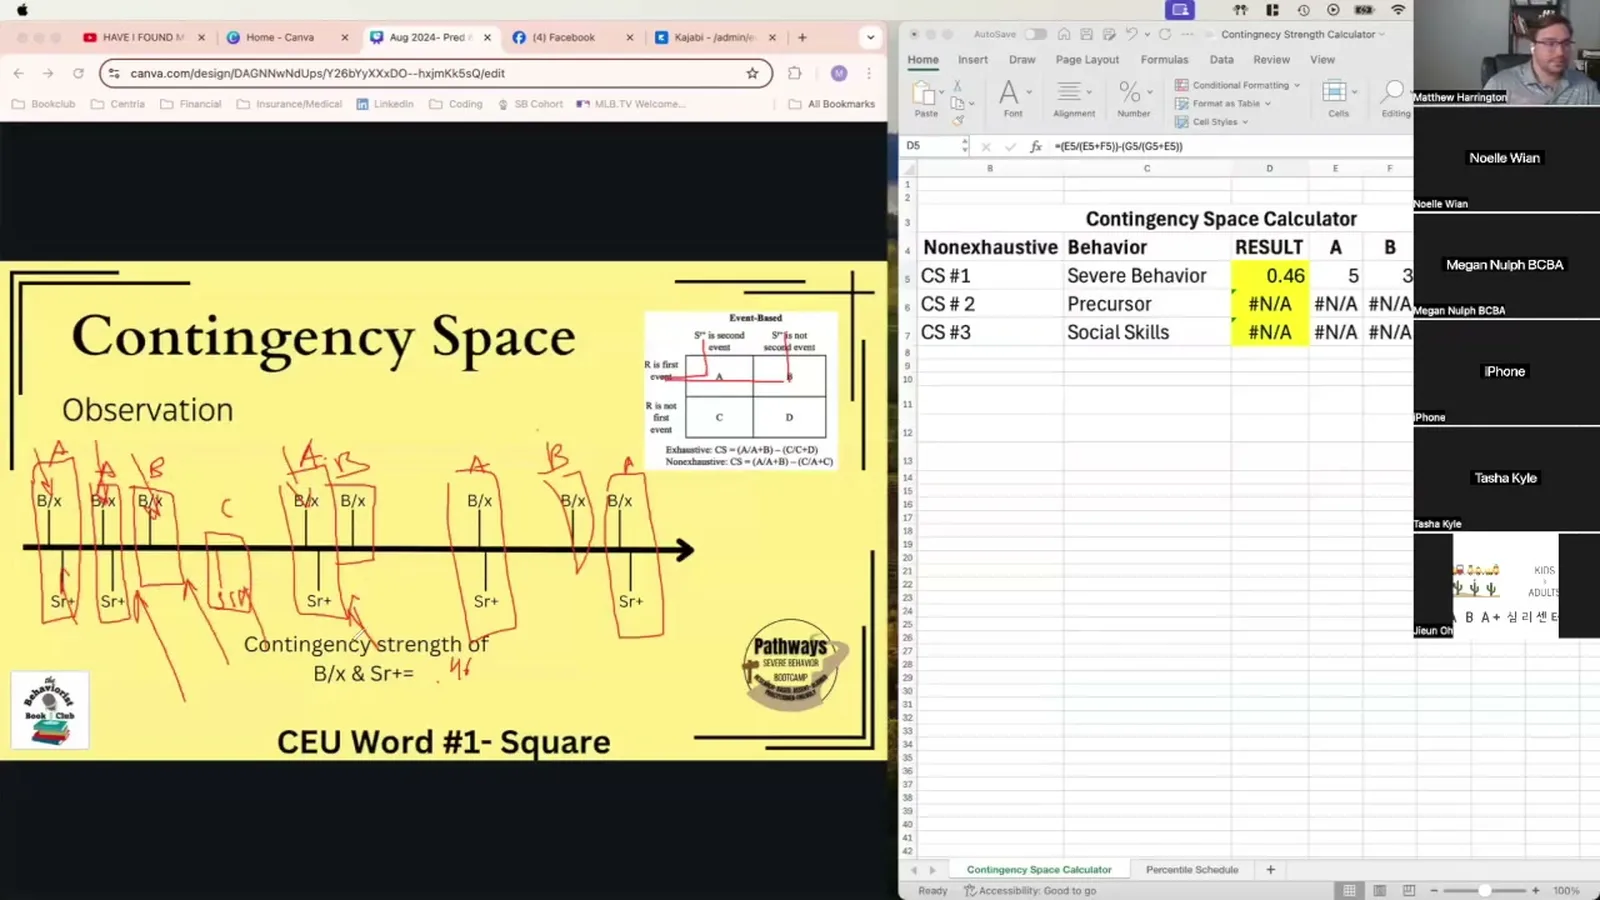
The setup is a four box grid, close to a Punnett square from biology. Box A is when the response happens and the payoff follows. Box B is when the response happens and no payoff follows. Box C is when no response happens but the payoff shows up anyway. You watch, and you tag each event as it goes by.
Then run the math. Divide A by A plus B. Divide C by A plus C. Subtract the second number from the first, and what is left is your contingency strength.
However, math is the language of science. The demonstration and manipulation of precise variables is how we communicate and is truly what we would call objectifying a scenario.
From the talk — Matt Harrington
Reading One Real Observation: A Score of 0.46
Picture a half hour of watching, say 12:30 to 1:00. You mark each behavior and each payoff on a timeline. Some behaviors get the payoff and some do not, and sometimes the payoff shows up on its own. Each of those events becomes an A, a B, or a C.
In the sample from the talk, the counts were five A events, three B events, and one C event. Run those through the equation and you get 0.46. In plain terms, the behavior paid off about half the time it happened.
Now think like the learner. The thing you want most is on the table about half the time you act. You have no other way to get it. Fifty percent is not bad odds, so you keep going. A score near 0.46 is high enough to hold a behavior in place for a long time.
That is where the number earns its keep. The count covers thirty minutes, but the read points forward. If nothing in the room changes, expect the same odds and the same behavior tomorrow.
So, a contingency strength of 0.46 is relatively high. It means that there is a positive correlation with the behavior in getting the reinforcer.
From the talk — Matt Harrington
Building the Plan One Layer at a Time
Next the talk builds a plan layer by layer and scores each layer. Extinction is left out on purpose at the start. In plenty of real cases the behavior is too severe for a burst. Or the team is not trained to ride one out.
Layer one adds DRA (paying off a better behavior instead) for a mand (a request the learner makes). The severe behavior still pays off too. Count it out and you get 0.5 for the mand and 0.5 for the severe behavior. That is a coin flip, so the learner has no reason to switch. The new piece feels like progress on paper, but it will not cut the severe behavior.
Layer two adds payoff for the precursor (the smaller behavior that comes first). This is the same move as widening the window of reinforcement in SBT. It also shows up in the enhanced choice model (offering choices to head off escalation). Now the mand sits at 0.5, the precursor sits at 0.5, and the severe behavior drops to 0.1. It is still positive, but it is no longer the best bet in the room.
Layer three puts the precursor on extinction and prompts a mand instead. The mand climbs to about 0.9. The severe behavior stays near 0.1, and the precursor falls to zero or below. Strip off the labels and that is close to what SBT looks like at its core.
And that's why FCT works so well, because the FCR, the Functional Communication Response, or the mand, has such a higher contingency strength than the severe behavior.
From the talk — Matt Harrington
The Percentile Schedule Equation for Shaping
Shaping gets called an art more than a science. The percentile schedule (a formula for timing reward) turns that art into a number you can set. The equation in the talk is K = (M + 1)(1 - W). Each letter is a knob you already turn by feel.
K is the value the next response has to beat. M is how far back you look: three recent sessions, five, whatever you pick. W is the density of reinforcement, or the chance a response earns a payoff. A W of 0.9 means most responses get paid. A W of 0.1 means almost none do.
Here is the worked example. Set M to five and W to 0.7, and the equation returns 1.8. Sort the last five results from smallest to largest, and 1.8 points at step two. So the next response has to beat step one to earn a payoff. As the learner improves, that sorted list slides up and the target moves to three on its own. A step two response, good enough last week, now earns nothing.
Think about a child you are shaping to sit at a table. The last three times were ten seconds, twelve seconds, and fifteen. Then you get fourteen. Most of us pay that off on instinct. The percentile schedule is that same call, made out loud and on purpose.
So the percentile schedule tells you when to reinforce and it tells you when not to reinforce.
From the talk — Matt Harrington
Choosing W: Speed Against Safety
The real clinical question is which knob to turn. Do you raise W, or do you stretch the window M? Raising W moves the needle more, so that is where the talk starts.
A high W means a lot of payoff and small shaping steps. The learner rarely touches extinction, so the work looks like errorless learning (teaching with heavy prompts, few errors). Growth comes slow and steady. This is what micro shaping (very small steps) in SBT is really doing. Pick it when the risk is high. If a failed step means head banging on concrete, you want slow and safe.
A low W means less payoff and more contact with extinction. That brings extinction induced variability (new responses that appear under extinction), and variety is what drives big jumps. The curve climbs faster but wobbles more on the way. Pick it when a miss is not dangerous, like a social skill goal.
Most of us already drift this way by feel. Early steps are tiny, five seconds to ten seconds. Later steps get bold, two minutes to three minutes. Naming W makes that drift visible. It also means staff can run the same plan twice, which cuts fidelity (running the plan as written) errors.
So a W of 0.1 means that there's a 10% chance that a response is going to be reinforced.
From the talk — Matt Harrington
What the Math Does Not Cover
This math covers one slice of the work: the component intervention (the piece that targets the behavior itself). It assumes you already know the function, the precursors, and the replacement behavior. The talk is not about running a functional analysis (a test of why behavior happens). Ethics, safety plans, response classes (behaviors that do the same job), and generalization all sit outside it.
It also does not belong in your hand during a session. The point is to know how each variable pushes the outcome. Once you know that, you can tell an RBT (the front-line staff person) to start paying off the precursor. You will know exactly why you said it.
The real return is prediction. Score the contingency strength you have now. Score the one your new plan would create. If the number on the severe behavior does not fall, the plan will not work. You know that before anyone runs it.
We should not be pulling out a spreadsheet and doing a calculation between every response.
From the talk — Matt Harrington
Common questions
What is contingency strength in ABA?▾
It is the chance that a behavior will earn a payoff, based on what happened in the past. Think of it as how taught or how stuck a behavior is. The score runs from positive one down to negative one. A long history of payoff pushes it high, and a behavior with no history sits near zero.
How do you calculate contingency strength by hand?▾
Watch a stretch of time and tag each event. A is response then payoff, B is response with no payoff, and C is payoff with no response first. Then divide A by A plus B, and divide C by A plus C. Subtract the second result from the first. Five A events, three B events, and one C event give you 0.46.
Why does functional communication training work?▾
The talk argues it is not the prompts or the errorless learning. It works because the mand pays off close to every time while the severe behavior pays off almost never. That gap in contingency strength is the whole engine. Shrink the gap and the plan stalls. That is why a half measure that leaves the severe behavior at 0.5 does not move anything.
What is the percentile schedule equation?▾
The form used in the talk is K = (M + 1)(1 - W). K is the value the next response must beat. M is how many recent observations you look at. W is the density of reinforcement, the chance a response gets paid. Set M to five and W to 0.7 and you get 1.8. That points at step two in a sorted list of the last five results.
Should I use a high or low reinforcement density when shaping?▾
Match it to the risk. A high W means small steps and little contact with extinction. Progress is slow and steady, which is what you want when a failed step could mean serious harm. A low W means more extinction contact and more variety, so progress is faster but bumpier. Use it when a miss costs nothing more than a slow session.
About the speaker
Matt Harrington is a behavior analyst. He has worked in clinic and telehealth, with early intervention clients and later with older adults on social skills. He is trained in PFA and SBT (an assessment and treatment method). He says he has run it dozens of times. He built this session from material he first wrote for a severe behavior boot camp. He hosts the ABA Clubhouse community, where he posts recordings and follow up discussion for sessions like this one.
This summary was generated from the recording’s transcript and reviewed for accuracy. Quotes are taken word for word from the talk.
What you'll learn
- 1Learning Objectives Upon completion of this presentation, participants will be able to:
- 2Analyze the contingency strength of behaviors within an intervention using the contingency space equation to predict the likelihood of behavior change before implementation.
- 3Apply mathematical principles of contingency strength to design and modify behavior reduction interventions that are individualized to client needs rather than copied from previous cases.
- 4Evaluate shaping procedures using the percentile schedule equation (K = M + 1(1-W)) to determine appropriate reinforcement density and observation windows based on client risk factors and acquisition goals.
Concepts in this CEU
Related talks
Talks that cover the same concepts
Prediction and Probabilities: Three foundational equations to successful behavior reduction
The Behaviorist Bookclub
12 days of PFA & SBT
The Behaviorist Bookclub
Analyzing Assent and Taking Data
The Behaviorist Bookclub
Assent: Don't just say Yes!-
The Behaviorist Bookclub
Ethical Guardrails in Behavior Reduction
The Behaviorist Bookclub

Shaping Behavior Change when ADHD is in the Picture
The Behaviorist Bookclub
More from The Behaviorist Bookclub
Empowering Autonomy and Self-Management in ADHD Learners
The Behaviorist Bookclub
From Hours to Competence: Assessing and Developing Supervisee Skills
The Behaviorist Bookclub
Reflective Supervision and Provider Outcomes in ABA
The Behaviorist Bookclub
OpenCEU is supported by advertising from third-party sponsors. Sponsors are clearly labeled, have no influence over course content, instructors, or CEU decisions, and never appear on certificates. The BACB does not sponsor, approve, or endorse OpenCEU sponsors or their products.