Comparative Probability Analysis in ABA Explained
Comparative probability analysis guesses behavior function from how often a consequence follows behavior. Learn how it works and its weak spots.
Key takeaway
Comparative probability analysis is an older way to guess why a behavior happens. It looks at your ABC data. Then it checks how often one event follows another.
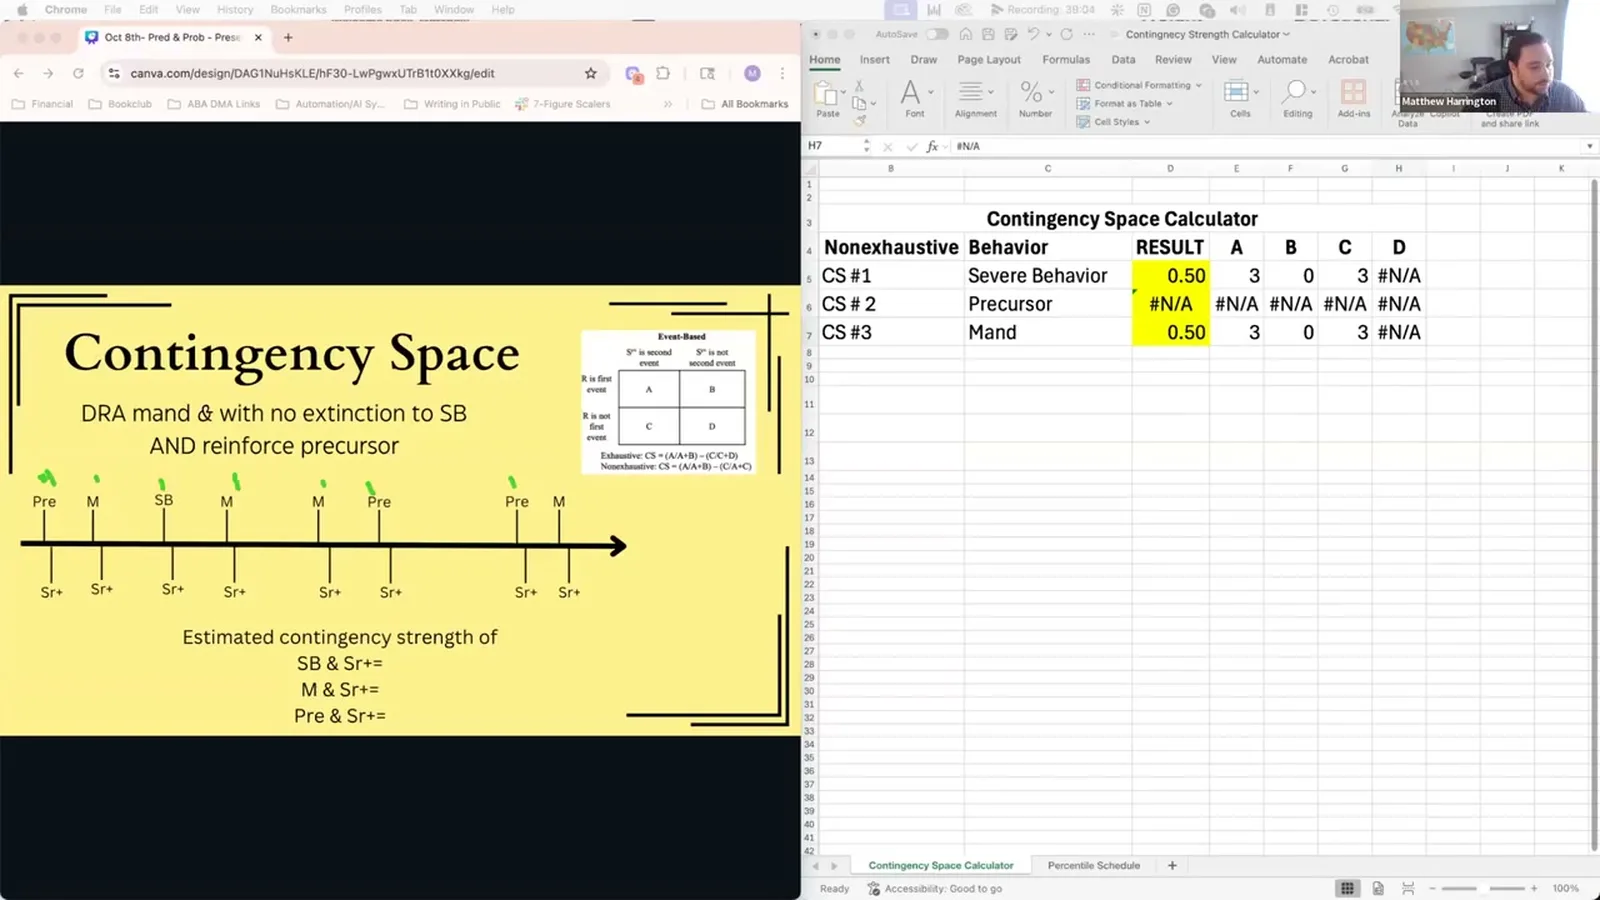
The Math Behind Behavior Reduction
On this page · 8 sections▾
Comparative probability analysis is an older way to guess why a behavior happens. It looks at your ABC data. Then it checks how often one event follows another.
This matters for BCBAs and RBTs who read behavior data every day. The method is simple and quick. It can point you toward a likely function fast. It uses data you likely already collect, so it costs little to try. But it has real weak spots, so you should know what it can and cannot tell you.
What comparative probability analysis is#
The core idea is conditional probability. That is a fancy phrase for a simple question. When one thing happens, how often does another thing happen right around it?
You take your antecedent, behavior, and consequence data. Then you count patterns. If a behavior almost always follows a certain event, that event looks important. The method uses that link to guess the function.
Matt Harrington frames it as the plain, first-pass tool. It came before newer, sharper methods like contingency strength. It gives you a rough read, not a precise one.
Why the ABC pattern matters#
Most teams already collect antecedent, behavior, and consequence data. That is the raw material this method needs. You do not have to run a new test to start.
The antecedent is what happens right before the behavior. The consequence is what happens right after. Comparative probability analysis simply asks which of these events keep showing up. A steady link is a signal worth chasing.
The value here is speed. You can glance at existing notes and spot a pattern. That early hunch helps you plan a closer look. It also gives the team a shared place to start the talk about function.
How it reads an escape pattern#
Say a child gets aggressive right after you place a demand. This shows up again and again in the data. Comparative probability analysis flags that tight link.
The comparative probability analysis would tell us that there is a high conditional probability that right when aggression occurs, we also have a demand being placed. The function is likely escape or something in that vein. From the talk — Matt Harrington
The logic is easy to follow. Demands keep showing up right before the behavior. So the behavior may work to escape those demands. That points you toward an escape function.
How it reads an attention pattern#
The same math works for attention. Here you watch what comes after the behavior. If attention keeps following the behavior, that is a clue.
if we have a behavior here that occurs and then we have attention that follows and that repeats behavior, attention, behavior, attention. The comparative probability analysis would tell us that there's a high probability that when, if attention occurs, a behavior has immediately occurred prior to that. From the talk — Matt Harrington
When that pattern repeats, the guess is clear.
Therefore, the function of the behavior is likely attention. From the talk — Matt Harrington
So the method spots a loop. Behavior, then attention, over and over. That loop suggests the behavior may be maintained by attention.
Where it falls short#
The method is helpful, but it is blunt. It tells you that two things go together. It does not tell you how strong that link really is.
There's a lot of weaknesses to the comparative probability analysis. From the talk — Matt Harrington
One issue is that many events happen close together. A demand and attention might both occur near the behavior. Simple counts can point two ways at once. That leaves you guessing which one matters more.
This is why newer tools came along. Contingency strength was built to fix these gaps. It does not just ask if events go together. It measures how much stronger one link is than the others.
So use comparative probability analysis as a starting point. It gives you a quick hunch about function. Then lean on stronger methods to confirm what is really driving the behavior.
How it compares to a functional analysis#
A functional analysis tests function on purpose. You set up conditions and watch the behavior change. It is strong, but it takes time and careful setup.
Comparative probability analysis is not a test at all. It only reads data you already have. So it cannot prove cause the way a hands-on test can. It can only suggest a likely link.
Think of it as a map, not a destination. It shows you which road looks busy. You still have to drive down that road to be sure. Pair the quick read with a real test when the stakes are high.
Using it wisely in practice#
The best use is early, when you are forming ideas. Scan the data and note the strongest patterns. Then treat those patterns as questions, not answers.
Watch for events that always travel together. If a demand and attention both cluster near the behavior, stay humble. The counts alone will not settle it. That is your cue to bring in a sharper tool.
Harrington's larger point is that math should serve good decisions. A quick probability read is one input among several. Use it to guide your next step, not to lock in a final plan. The goal is a clear picture of function, built from more than one source.
FAQ#
What is comparative probability analysis in ABA?
It is an older method for guessing a behavior's function. It counts how often events follow each other in your ABC data. A tight, repeated link suggests a likely function.
How is it different from contingency strength?
Comparative probability analysis only shows that events go together. Contingency strength measures how strong each link is. That extra math helps you rank which consequence matters most.
Is comparative probability analysis reliable?
It is a rough first read, not a final answer. Many events cluster near a behavior, so counts can mislead. Use it to form a hunch, then confirm with a stronger analysis.
Harrington walks through the full math and its newer replacement in Prediction and Probabilities: Three foundational equations to successful behavior reduction.
Turn this topic into a CEU
You just studied this. Now get credit for it.
Watch The Math Behind Behavior Reduction with Matt Harrington and earn 1 free BCBA CEU. Audit-proof certificate, delivered the moment you finish.