Three Equations BCBAs Use to Predict Behavior Change
Predict what an intervention will do before you run it using contingency space, the matching law, and the percentile schedule, from a BCBA-led CEU.
Key takeaway
Three equations, used together, turn a Board Certified Behavior Analyst (BCBA) from someone reacting to last week's data into someone who can call the next change before they make it.
Prediction and Probabilities: Three foundational equations to successful behavior reduction
On this page · 9 sections▾
Three equations, used together, turn a Board Certified Behavior Analyst (BCBA) from someone reacting to last week's data into someone who can call the next change before they make it. Matt Harrington, a BCBA who has run case loads, supervised techs, and trained other BCBAs, built a talk around three of them: contingency space analysis, the matching law, and the percentile schedule. Each one has its own deep page on this site. This page is the hub. It is the map of how the three fit together as one prediction framework, and how to use them in the messy middle of a supervision day.
You will not be doing math at the table with a kid. You will not be holding a calculator in one hand and a token board in the other. The point of these equations is not arithmetic. The point is that when you can say out loud what changed and why it changed, you can predict what the next change will do before you put it in place. That is the difference between a clinician guessing and a clinician steering.
Why prediction matters more than reaction in a caseload of 12 to 15#
Most BCBAs are running 12 to 15 clients, sometimes more, with six to eight hours of supervision a day. There is no room to redesign a plan from scratch every time something slips. What you need is a small set of tools that tells you, in two minutes, which knob to turn.
That is what these three equations do. They take the moment-by-moment changes you already see on a graph and give them a shared language. Once the language is shared, you stop arguing about whether a plan is "working" in the abstract and start arguing about the variables that drive it. That argument is shorter, cleaner, and you can run it during a fifteen-minute check-in.
These are the equations that should lead you to the corrective action that you need to take. From the talk — Matt Harrington
The other gift of prediction is replication. When a case goes well, you want to know why so you can do it again. When a case goes sideways, you want to know which variable moved so you do not chase the wrong one. Both of those questions have the same answer: name the equation, name the variable, then act.
As we boil these moment by moment actual changes in our client's behavior down to these equations, what you get is really good replication. From the talk — Matt Harrington
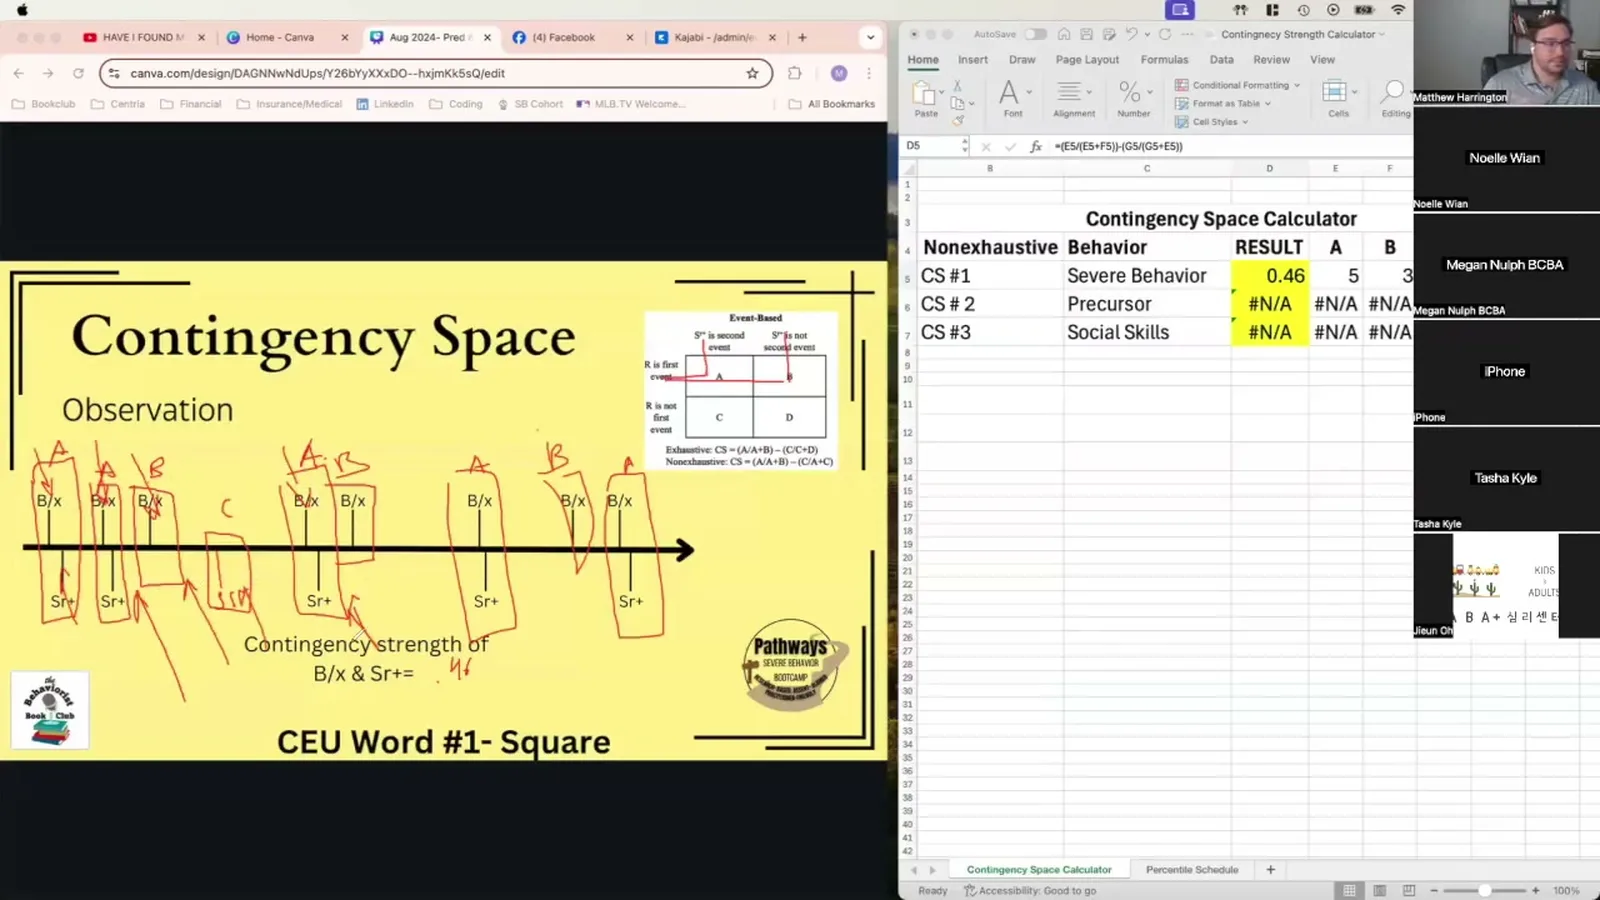
Equation one: contingency space analysis for learning history#
Contingency space analysis is the equation you reach for when you need to understand a learning history. A client does not behave in a vacuum. Every response has a history of what happens after it, and that history is built out of two probabilities: the probability of reinforcement when the response happens, and the probability of reinforcement when it does not.
Plot those two probabilities against each other and you get a space. Different spots on that space describe different relationships between behavior and consequence. A behavior with a high probability of reinforcement when it happens and a low probability of reinforcement when it does not is on a strong contingency. That is the one driving most of the responding you see. A behavior with a flat space, where reinforcement is just as likely either way, is on a weak contingency. That one will fade or get pushed around by other behaviors that have stronger ones.
For a BCBA, this is the equation that explains why a plan that looks good on paper falls apart in practice. If your replacement behavior has a weaker contingency than the problem behavior, the problem behavior wins. The fix is not a new plan. The fix is a stronger contingency on the response you want.
The deep page on this site walks through how to estimate the two probabilities from a session, and how to use them to predict whether your replacement behavior is going to hold. Read it before you write your next behavior reduction plan.
Equation two: the matching law for choice and rate of reinforcement#
The matching law shows up when there is more than one response in the room. There almost always is. A client can mand, or they can hit. They can ask for a break, or they can bolt. They can use the picture, or they can scream.
The matching law says that the rate of each response will match the rate of reinforcement for that response, relative to all the other reinforcement available. If hitting gets a fast adult reaction four times out of five, and manding gets a slow adult reaction one time out of five, hitting is going to take more of the response pie. It is not a discipline problem. It is a math problem.
This is why fidelity matters so much in skill-building. A staff person who reinforces the mand 60% of the time and reinforces the hit 100% of the time is not running the plan. They are running a different plan, and the client is doing exactly what the matching law predicts they will do.
For a BCBA, the matching law is the equation you use when a case is "almost working." The graph looks like it is bending, but severe behavior keeps coming back. The fix is not a new replacement. The fix is closing the gap between rates of reinforcement.
The deep page on this site shows how to use the matching law to predict severe problem behavior when fidelity is uneven, and how to design a contingency that the client's response history cannot ignore.
Equation three: the percentile schedule for shaping decisions#
The percentile schedule is the equation you reach for when you are shaping. Shaping used to be the part of the job that felt like art. You wait for a slightly better response, you reinforce it, and you wait for the next one. The percentile schedule turns that into a rule.
You set a window of recent responses. You pick a rank inside the window, often the top third or the top half. If the next response meets or beats that rank, you reinforce. If it does not, you wait. The window slides forward as the client gets better, and the bar slides with it. Without a calculator. Without a chart on the wall. You just need a small running list of the last few responses.
For a BCBA, the percentile schedule is the equation that protects shaping from drift. Drift happens when a clinician keeps reinforcing the same level of response for weeks because it feels like progress. The percentile schedule stops that. It forces a moving target so the client keeps moving.
The deep page on this site shows how to use the percentile schedule to shape severe behavior down without an extinction burst, including how to pick the window size and how to talk a tech through it.
How to use all three in one supervision session#
Walk in, look at the graph for sixty seconds, then ask three questions in this order.
One. Is the contingency space supporting the response I want? If reinforcement is flat across responding and not responding, the contingency is weak. Tighten it.
Two. Is the rate of reinforcement on the right response higher than the rate of reinforcement on the wrong response? If not, the matching law will fix the case the wrong way. Even out the fidelity, or change which response gets the faster reaction.
Three. Is the bar for reinforcement moving forward, or have we been reinforcing the same response level for two weeks? If it is stuck, the percentile schedule says move the window.
Three questions. Two minutes. You will not get every case right. You will get most of them pointed in a useful direction, and that is what supervision is for.
The ethical guardrails check before you change a variable#
Before you change anything, run the change against your guardrails. Matt frames three: every intervention is fully informed and assented to throughout, you are causing no further harm, and you are building resistant repertoires.
The guardrails are a strong reason why you as a clinician need to make changes in your programming. This is not a list of do and do not use. From the talk — Matt Harrington
The point is not that you avoid certain procedures. The point is that the math tells you what will work, and the guardrails tell you whether you should use that thing on this client, in this home, with these parents, today. If the predicted change would violate the guardrails, you do not run it. You pick a different variable.
A small-tweak decision tree for messy cases#
When the case is messy, you do not redesign. You tweak one variable, you watch the data for two sessions, and you decide.
If problem behavior is climbing, check the matching law first. The rate of reinforcement on the wrong response is too high somewhere, usually with a staff person or a setting you have not seen this week.
If the replacement is climbing but problem behavior is not falling, check contingency space. The replacement is on a strong contingency. The problem behavior is also on a strong contingency. Both pay, so both stay.
If the replacement is stalled at the same level for two weeks, check the percentile schedule. The bar is not moving, so the client is not moving.
That is the whole tree. One variable at a time. Two sessions of data. Then decide.
I want us to acknowledge that the language of science is math. Quantitative analysis is the thing that moves science forward, and it helps us understand the way different variables interact with each other. From the talk — Matt Harrington
Frequently asked questions#
Why do BCBAs need equations at all?
Because language alone is too loose. Two BCBAs can both say a plan is "working" and mean different things. When you point at an equation, you point at a variable. Variables are arguable. Once the variable is named, the argument gets short and the next move gets clear.
Do I really have to do math during supervision?
No. You will almost never write down a number. The equations are there to organize what you are already noticing. You look at a graph, you ask which equation is being violated, and you change one variable. The math runs in the background. Your job is to name it.
Which equation should I learn first?
Contingency space, because every other decision sits on top of it. Once you can describe a learning history in terms of two probabilities, the matching law and the percentile schedule are easier to use, because you already know what reinforcement is doing in the case.
How do these equations connect to ethics?
The equations tell you what will change behavior. The guardrails, including assent, no further harm, and building resistant repertoires, tell you whether that change is the right one for this client. You run the equation first, then the guardrail check, then the move.
Can I use these with parents and techs?
Yes, in plain language. You do not say matching law. You say, when the wrong thing pays faster than the right thing, the kid will do the wrong thing more. That sentence is the matching law. Parents and techs hear it and run with it.
Get the full CEU#
If this gave you a way to think about your next supervision session, the full talk goes deeper into each equation, with the contingency space diagrams, the matching law worked examples, and the percentile schedule walkthrough. It is one free Continuing Education Unit (CEU) on openceu.com.
Turn this topic into a CEU
You just studied this. Now get credit for it.
Watch Prediction and Probabilities: Three foundational equations to successful behavior reduction with Matt Harrington and earn 2 free BCBA CEUs. Detailed certificate, delivered the moment you finish.