Contingency Strength Formula: How BCBAs Predict If a BIP Will Work
Learn the event-based contingency strength equation, classify A/B/C events from a session, and predict if your behavior plan will reduce problem behavior, from a BCBA-led CEU.
Key takeaway
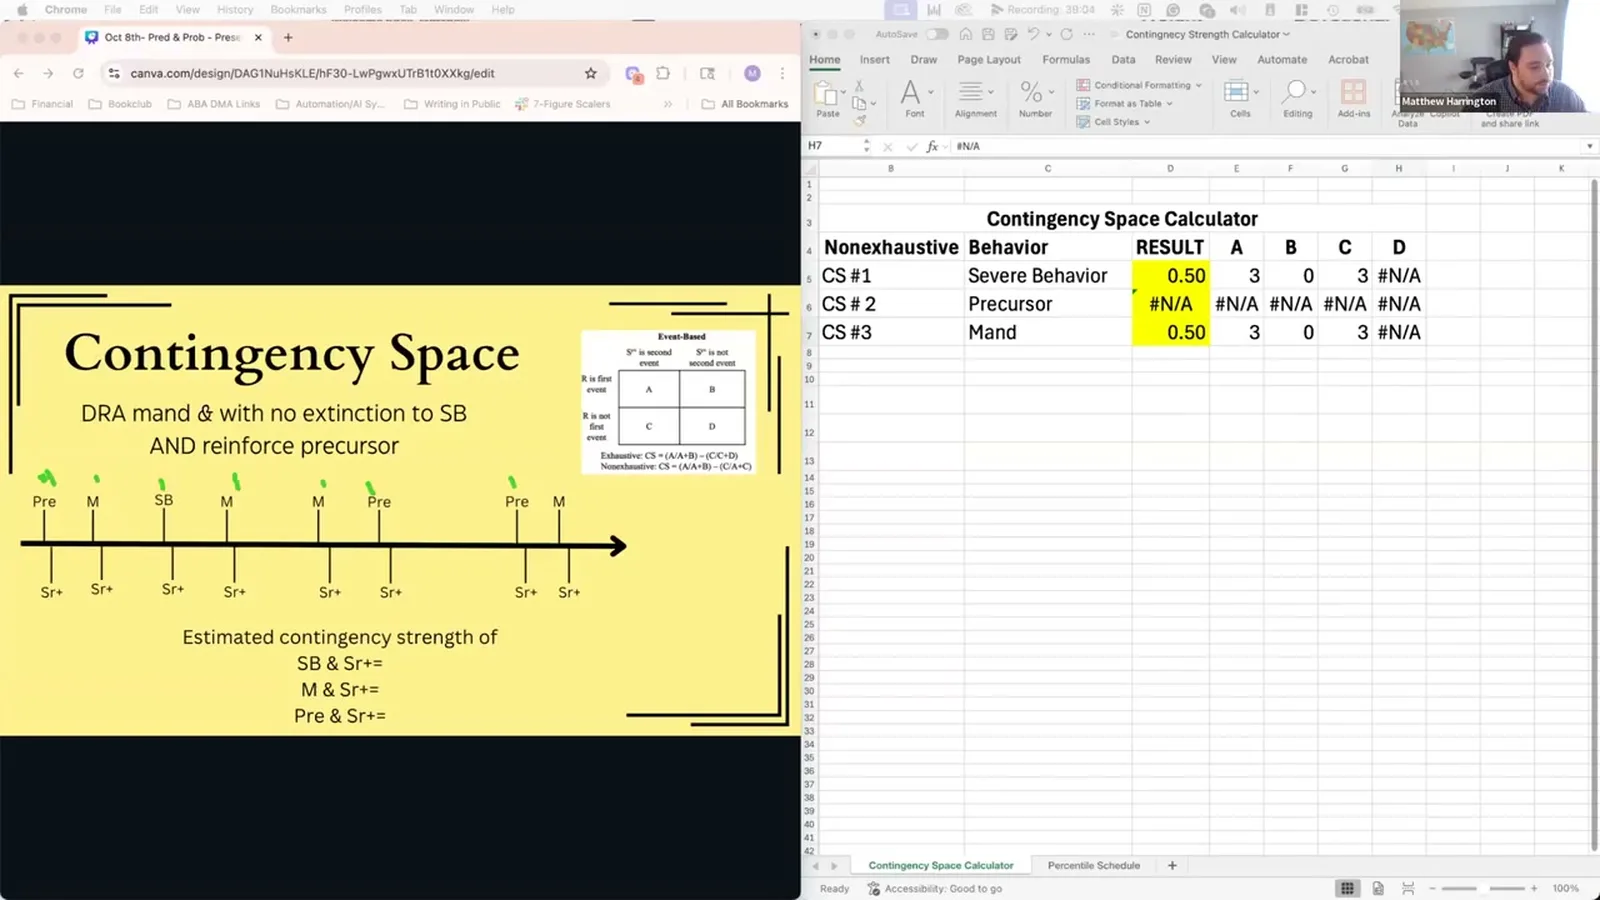
The contingency strength formula is A divided by (A plus B), minus C divided by (A plus C), and a session with 5 A's, 3 B's, and 1 C gives you 0.46.
The Math Behind Behavior Reduction
On this page · 9 sections▾
The contingency strength formula is A divided by (A plus B), minus C divided by (A plus C), and a session with 5 A's, 3 B's, and 1 C gives you 0.46. That number tells a Board Certified Behavior Analyst (BCBA) whether a behavior intervention plan will actually reduce problem behavior. A contingency is the link between a behavior and what follows it. The math turns gut feel into a real prediction. You can run it on paper during a session. You can run it on a draft BIP at 9 p.m. The point is to stop guessing.
What contingency strength actually measures#
Contingency strength is one number. It runs from negative one to positive one. A score near positive one means the behavior almost always gets the reinforcer. A score near zero means the link is weak. A negative score means the reinforcer shows up when the behavior does not.
Contingency strength is the probability that future behavior will result in stimuli being provided based on past events. Like I said, stronger the contingency, not consistency, the more robust and consistent. From the talk — Matt Harrington
So this is not a count. It is a probability. It tells you how stuck a behavior is. A learner with a long history of getting reinforced for hitting will keep hitting. The contingency is strong. A learner in a new room with a new staff has no history. The contingency is weak.
That matters for your plan. If the problem behavior has a strong contingency, your replacement behavior has to beat it. You need a higher number on the replacement side than on the problem side.
The A, B, C event classification (with examples)#
You score events one at a time. You pick an anchor. The anchor is usually the problem behavior. Then you walk through the session and tag each moment.
If the response occurs and then the reinforcer occurs, right, that would be A. If the response occurs, but the reinforcer does not occur, B. If the response does not occur and the reinforcer does, now it's a C. From the talk — Matt Harrington
Here is the short version in plain words:
- A event: The behavior happened. The reinforcer followed. Both true.
- B event: The behavior happened. The reinforcer did not follow. The behavior was on extinction in that moment.
- C event: The behavior did not happen. The reinforcer still showed up. Free delivery.
Think of a kid asking for a break. A nice "break please" gets a break. That is an A. A whine gets ignored. That is a B for the whine. The staff hands the kid a break with no ask at all. That is a C for the ask. You score every moment this way. You can do it from a video. You can do it from a tally sheet.
The non-exhaustive equation, written out#
Here is the math in one line. Let A, B, and C stand for the count of each event type.
Contingency strength = A / (A + B) minus C / (A + C)
The first part is how often the behavior gets reinforced when it happens. The second part is how often the reinforcer shows up on its own. You subtract one from the other. The leftover is the real signal.
This is the non-exhaustive event-based version. There are fancier ways. Interval-based math is more exact. So is the exhaustive version. But neither one runs on paper in a hallway.
The non-exhaustive contingency strength equation. And this says, if you take A divided by A plus B and subtract that from C divided by A plus C, basically the number of these events, well, then you get your contingency strength. From the talk — Matt Harrington
Use this version for quick reads. Save the fancy versions for research papers or for software that does the work for you.
Walking through a real session: 5 A's, 3 B's, 1 C#
Let's run the numbers on a real count. You watched a 30 minute session. You picked the target behavior. You tagged each event. You ended up with 5 A's, 3 B's, and 1 C.
Step one. Plug in the first part.
A divided by (A plus B) = 5 / (5 + 3) = 5 / 8 = 0.625
Step two. Plug in the second part.
C divided by (A plus C) = 1 / (5 + 1) = 1 / 6 = 0.167
Step three. Subtract.
0.625 minus 0.167 = 0.458, which rounds to 0.46.
That is your contingency strength for this behavior. It is a real number. You did not guess it.
What does 0.46 mean? It means the behavior pays off about half the time it happens. The reinforcer rarely shows up free. From the learner's view, this behavior is the best bet on the table. They will keep doing it.
What a 0.46 contingency strength tells you to do next#
A score of 0.46 is high. Not the highest. But high. The behavior is working for the kid. That is why it keeps happening. So your job is to lower this number and raise the number on a better behavior.
You have three real moves:
- Cut the A's on the problem behavior. Put it on extinction when you can. Fewer A's drops the first half of the equation.
- Add A's on a replacement. Reinforce a mand or a precursor. Build a strong contingency for the safer behavior.
- Stop the free C's. If the reinforcer shows up without the behavior, the learner does not need the behavior. But too many free C's can also make the problem behavior look weaker on paper than it is. Watch this part.
Run the math again after one week of the new plan. If the problem score did not drop, the plan did not work. You do not need to wait a month to know. The numbers tell you fast.
When to use the quick method vs. interval-based math#
The event-based method is fast. You can do it in your head. It is good for live work. It is good for plan checks. It is good for staff training. The trade is some precision.
Interval-based math splits the session into time chunks. You score each chunk. It catches behaviors that bunch up. It catches reinforcers that drift. It is more honest about the timeline. But you cannot do it on paper during a session. You need a tool.
Use event-based for any of these:
- A first read on a new client
- A check on a draft BIP before you write it up
- A quick score during a session walk-through
- A team meeting where you want one number on the board
Use interval-based or exhaustive math for any of these:
- A research write-up
- A peer review or a fidelity check
- A case where the behavior happens in tight bursts
- A case where the reinforcer is on a time schedule
For most BCBA work, event-based is enough. The goal is the right call, not the perfect decimal.
How to fold this into your BIP draft tonight#
You can use this tonight. Open your last session notes. Pick the target behavior. Count A, B, and C events from the notes. Run the math.
Then write the plan with three numbers in mind:
- The current contingency strength of the problem behavior.
- The target contingency strength of the replacement behavior.
- The gap between the two.
The bigger the gap, the more the learner picks the replacement. That is the whole game. Functional communication training works because the mand sits near 1.0 and the problem behavior sits near zero or below. A small gap means the learner has no real reason to switch.
Write the gap on the top of the BIP. When the team asks why this plan will work, point at the gap. When the team asks how you will know in a week, point at the math. You are no longer arguing about feel. You are arguing about numbers.
Frequently asked questions#
What contingency strength score is high enough to predict behavior change?
A gap of about 0.5 or more between the replacement and the problem behavior is a strong sign the learner will switch. A score above 0.7 on the replacement, paired with a score near zero or negative on the problem behavior, is the goal in most reduction plans. Below 0.3 on the replacement means the plan is too weak. Add reinforcement or cut the problem behavior's payoff.
Can I calculate contingency strength from ABC data I already have?
Yes. Standard ABC notes give you almost everything. Pick a target behavior as the anchor. Walk each row. Tag A, B, or C. Count them. Run the formula. The one thing many ABC sheets miss is the free C event, when the reinforcer showed up with no behavior at all. Add a row for those if your sheet does not have one.
Why does the contingency strength formula give a negative number sometimes?
The score goes negative when the reinforcer shows up more often without the behavior than with it. The C side wins. This shows up in extinction plans and in pure noncontingent reinforcement. A negative score means the behavior is not paying off in real life. That is good if the behavior is unsafe. It is a sign the plan is working.
Ready to learn the math behind the rest of your BIP?#
Matt Harrington walks through the full formula, three more worked sessions, and the percentile schedule for shaping in the recorded CEU. Watch the talk and earn your CEU at the link above.
Turn this topic into a CEU
You just studied this. Now get credit for it.
Watch The Math Behind Behavior Reduction with Matt Harrington and earn 1 free BCBA CEU. Detailed certificate, delivered the moment you finish.