Contingency Space Analysis: Scoring A, B, C Events From Session Data
Code response and reinforcer events as A, B, or C, then read the contingency space square the way Matt Harrington teaches it, from a BCBA-led CEU.
Key takeaway
Contingency space analysis is a method where you pick one response as your anchor point, then walk the session stream event by event and code each one as A, B, or C based on whether a response and a reinforcer both showed up.
The Math Behind Behavior Reduction
On this page · 8 sections▾
Contingency Space Analysis: Scoring A, B, C Events From Session Data
Contingency space analysis is a method where you pick one response as your anchor point, then walk the session stream event by event and code each one as A, B, or C based on whether a response and a reinforcer both showed up. The same stream of behavior produces different scores depending on which response you anchor to, which is why two BCBAs (board certified behavior analysts) watching the same kid can come away with different read-outs. Once the events are coded, a simple square gives you a number for contingency strength, and that number tells you whether your plan is likely to move behavior or sit flat.
This page walks through the method the way Matt Harrington teaches it in his CEU on the math behind behavior reduction. The goal is not to do this perfectly with a spreadsheet during a session. The goal is to read a session stream and roughly know which events you would code which way, so you can spot when a plan is set up to fail before you ever run it.
What the contingency space square represents#
The contingency space square is a 2x2 grid. Across the top: did a response happen, yes or no. Down the side: did a reinforcer happen, yes or no. Every event in your session stream falls into one of four cells.
If you're familiar with Punnett squares in biology, well, surprise, we're back there. All this does is gives us a way to classify things so that we can then do a little bit of math later and start to see the manipulation of the contingency strength. From the talk — Matt Harrington
The cells get short names:
- A is when the response happened and the reinforcer followed.
- B is when the response happened but no reinforcer followed.
- C is when the response did not happen, but a reinforcer showed up anyway.
- The fourth cell (no response, no reinforcer) is usually ignored in the simple version.
Count up your A's, B's, and C's. Plug them into the equation A / (A + B) minus C / (A + C). That number is your contingency strength. It runs from positive one (every response gets a reinforcer, and reinforcers only show up after responses) down to negative one (reinforcers only show up when the response does not happen). The higher the number, the more "stuck" the behavior is.
Picking your anchor: response or reinforcer#
You cannot code a stream of events until you pick what counts as "the response." This is the move most people skip, and it is the reason their numbers come out weird.
So you're observing a learner, and you say a behavior happened, and then it was closely followed by a reinforcer. Behavior, reinforcer, behavior, reinforcer, etc. So what event-based tells us to do is we're going to choose an anchor point. We're going to choose the probability that behavior occurs and then SR follows. From the talk — Matt Harrington
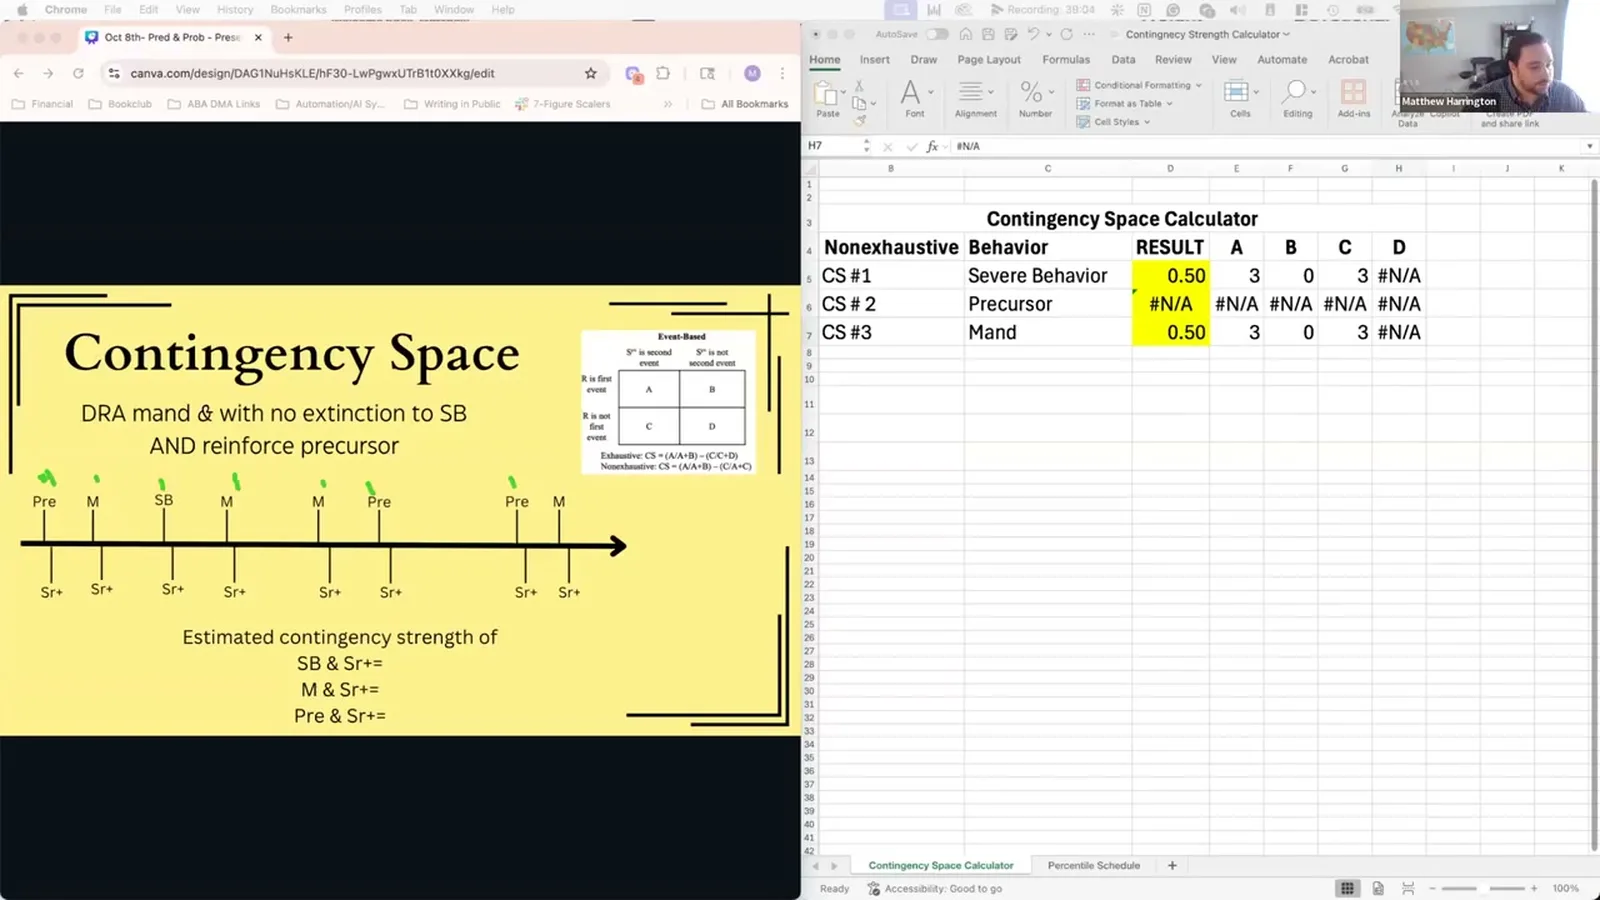
In an FCT (functional communication training) plan, you usually want to code the same stream twice. Once with the severe behavior as the anchor. Once with the mand as the anchor. You will get two different contingency strengths from the exact same set of events, and the gap between those two numbers is what predicts whether the plan will work.
If you only anchor on one response, you only see half the picture. The kid lives in the whole picture.
Coding A, B, and C events from a session timeline#
Picture a 30-minute session as a straight line. Each tick on the line is either a response, a reinforcer, or both. You walk down the line one tick at a time and ask two questions: did my anchor response happen, and did a reinforcer happen?
Here is what coding looks like with severe behavior as the anchor:
- Severe behavior, then snack delivered. That is an A. Response yes, reinforcer yes.
- Severe behavior, no snack. That is a B. Response yes, reinforcer no.
- No severe behavior, but a snack came out for something else. That is a C. Response no, reinforcer yes.
Now you have a row of letters. A, A, B, C, A, B, A, B, A. Count them: five A's, three B's, one C.
Plug into the equation: 5 / (5 + 3) is 0.625. 1 / (5 + 1) is 0.167. Subtract: 0.46. That is your contingency strength for severe behavior. A learner who can get reinforcement roughly half the time they engage in severe behavior will keep doing it, especially if no other option is on the table.
You do not need a data app to do this. You need a pen, a timeline, and a clear anchor.
Why one event stream produces different scores for different responses#
This is the part of contingency space analysis that catches new BCBAs off guard. The exact same 30-minute session, coded against two different anchor responses, gives you two different contingency strengths. Both are correct. They are answering different questions.
Now, from the perspective of the man, because now we're calculating the man contingency strength, this is a C, A, A, A, C, C. And remember, the reason why this is a C is because in this event, no manned occurred, right? So, a response is not the event, but reinforcement did occur. From the talk — Matt Harrington
Read that one more time. An event that gets coded as A when you anchor on severe behavior (severe behavior happened, snack came out) gets coded as C when you anchor on the mand (the mand did not happen, but a snack still came out). Same event. Different code. Different math.
This is why a plan can look fine on paper and break on the floor. If you only score the mand, the mand looks great. But the kid is comparing the mand's contingency strength against the severe behavior's contingency strength, in real time, every time they pick what to do next. If both numbers are around 0.5, the kid flips a coin. If the mand sits at 0.9 and severe behavior drops to 0.1, the kid mands.
A useful habit: every time you write a behavior reduction plan, code the same stream twice. Once for the target you want to grow. Once for the target you want to shrink. If both numbers look similar, the plan is not yet a plan.
How this differs from comparative probability analysis#
Contingency space analysis lives in the same neighborhood as comparative probability analysis, but it is a different tool.
It is similar, but a little bit more complex because instead of talking about functions, we're now going to talk about the general reinforcement that occurs. And what and be able to compare the probability of when something does occur and the probability of when something doesn't occur to get an estimate on contingency strength. From the talk — Matt Harrington
Comparative probability analysis is a function-finding tool. It asks: when this behavior happens, what tends to follow? It is great for an FA (functional assessment) read-out, where you want to know if attention or escape is the consequence riding behind the behavior.
Contingency space analysis is a plan-strength tool. It asks: across this session, how often does this response actually contact reinforcement, and how often does reinforcement happen without this response? That second piece, the C cell, is the part comparative probability analysis tends to skip.
If you already know the function and you are now trying to predict whether your replacement skill will out-compete the severe behavior, contingency space analysis is the better fit. Function tells you what reinforcer to use. Contingency strength tells you if your plan delivers it densely enough to matter.
Putting it on paper without a spreadsheet#
Matt is clear that the math is not the point. The point is to look at a session and feel the shape of the contingency strengths without doing long division.
Three habits that make this practical on the floor:
- Pick two anchors before the session, not after. Write them on the top of your data sheet. Usually one target behavior you want to grow, and one severe behavior you want to shrink.
- Tally A's, B's, and C's in two columns. Five-minute chunks are fine. You are not aiming for precision; you are aiming for the rough ratio.
- Compare, do not calculate. If the A column for the mand has twice as many tally marks as the A column for severe behavior, the plan is probably moving. If they are close, the plan is not yet doing work.
Once you have the habit, you can run a rough contingency space read-out in your head while you watch a session. You will catch a flat plan before it eats two more weeks.
Frequently asked questions#
Do I need a data app to do contingency space analysis?
No. BDataPro and a few other apps will calculate event-based contingency strength for you, and the ISCA (interview-informed synthesized contingency analysis) app can do it too. But the version Matt teaches is the quick, non-exhaustive event-based method, and it was designed to be done by hand on a session sheet. Tally A's, B's, and C's during the session. Run the subtraction after. A simple printed grid works for most cases.
What's the difference between event-based and interval-based contingency strength?
Event-based scoring tags each response and reinforcer as it happens, then codes the relationship between them. Interval-based scoring chops the session into fixed time blocks and asks whether a response and a reinforcer happened in each block. Interval-based is a little more accurate, especially when responses cluster, but it is harder to do by hand. Event-based is the version you can run with a pen during a real session, which is why Matt recommends it as the default.
Can I score contingency space analysis from a video recording after the session?
Yes, and for severe behavior cases that is often a smart move. Pause, rewind, watch with a timeline open, and code each event into A, B, or C against your anchor. The advantage of video is that you can code the same stream against two anchors without missing anything. The downside is time. For most cases, a clean live tally is enough.
Take the full CEU#
The session this method came from is one CEU credit, BCBA-led, and walks through three other equations beyond contingency space analysis: contingency strength comparisons across FCT components, the percentile schedule for shaping, and how reinforcement density changes the speed of skill acquisition. If you want the full math behind a behavior reduction plan, the talk lays it out end to end.
Watch the recording on openceu.com
Turn this topic into a CEU
You just studied this. Now get credit for it.
Watch The Math Behind Behavior Reduction with Matt Harrington and earn 1 free BCBA CEU. Detailed certificate, delivered the moment you finish.