View event analytics and insights
Check how people found your event page, then step back and see growth trends across your whole organization.
Open Analytics for one event
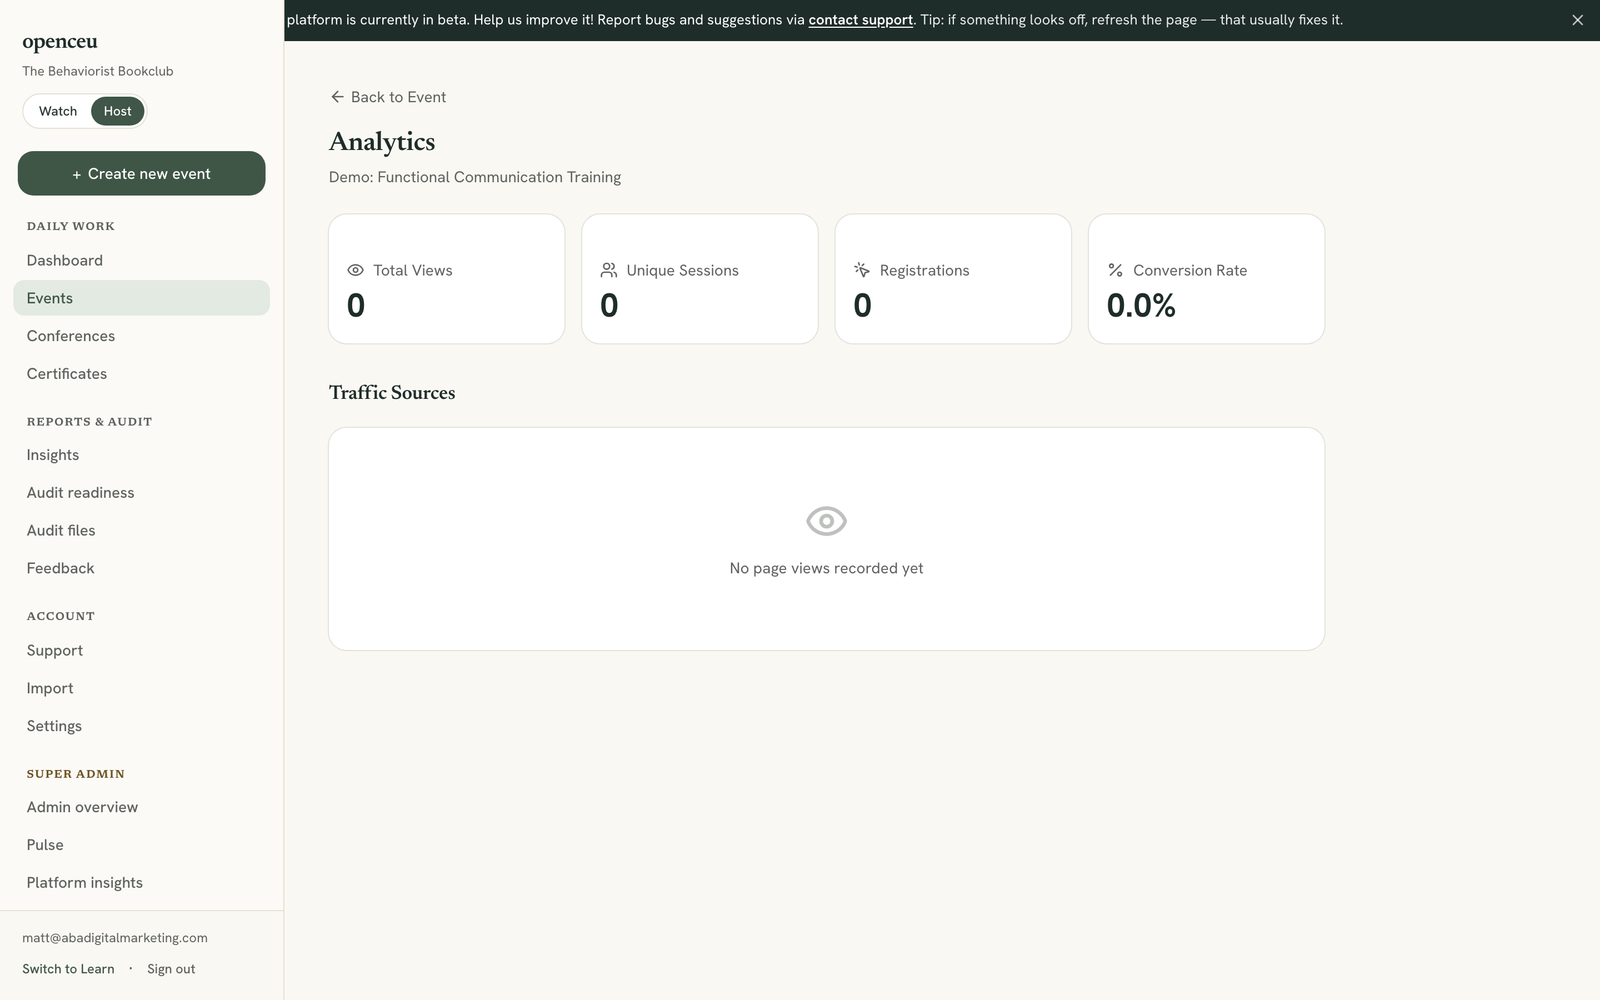
Go to your event and click Analytics in its checklist. You will see total views, unique sessions, registrations, and your conversion rate.
Check your traffic sources
The Traffic Sources table shows where your views came from, and how many of each turned into a registration. The Devices section below shows the split between desktop, mobile, and tablet.
Open Insights for your organization
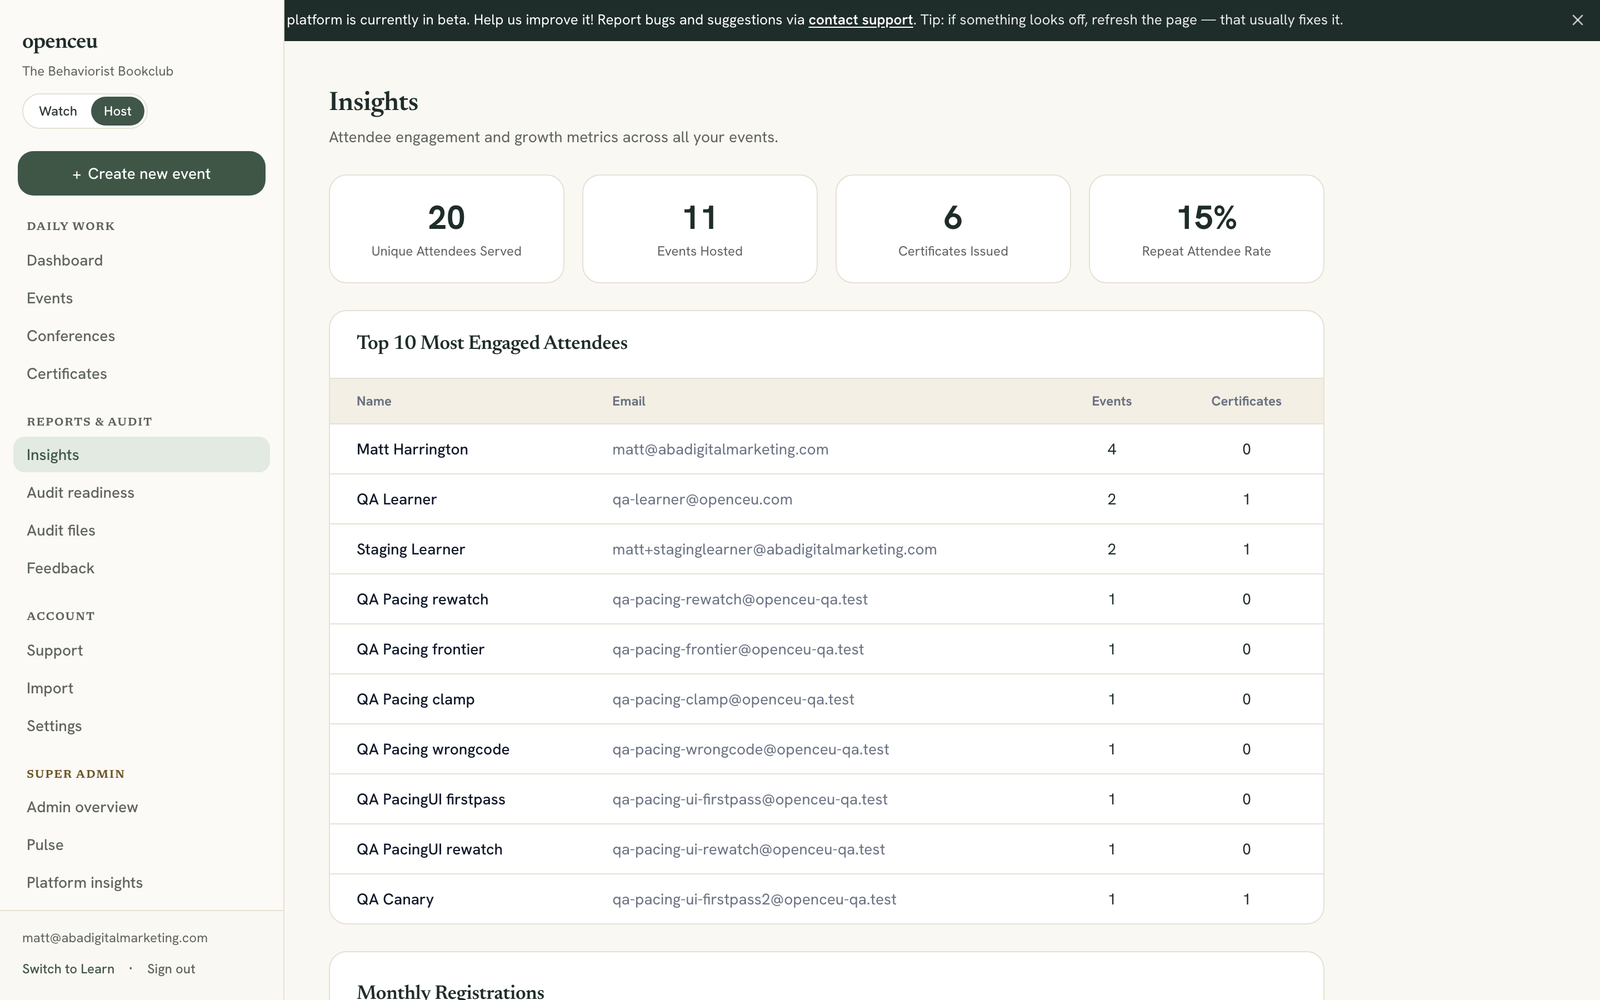
In your side menu, under Reports & audit, click Insights.
Read your growth numbers
You will see your total unique attendees, events hosted, certificates issued, and repeat attendee rate. Scroll down for a role breakdown, your top 10 most engaged attendees, and a chart of registrations over the last 12 months.
Still stuck? Contact support and we'll help.